IDLE has a debugger built into it. It is very useful for stepping through a program and watching the variables change values.
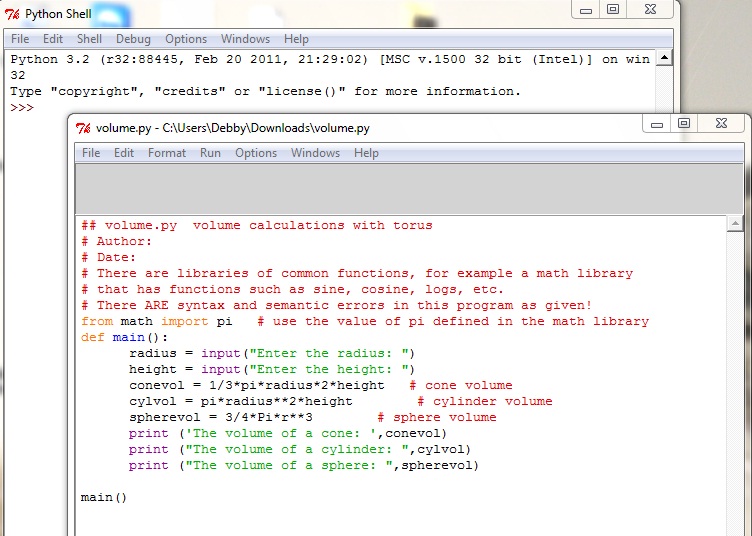
Start IDLE and open this program source file.
In the Shell window, click on the Debug menu option at the top and then on Debugger. You will see a "Debug Control" window like this
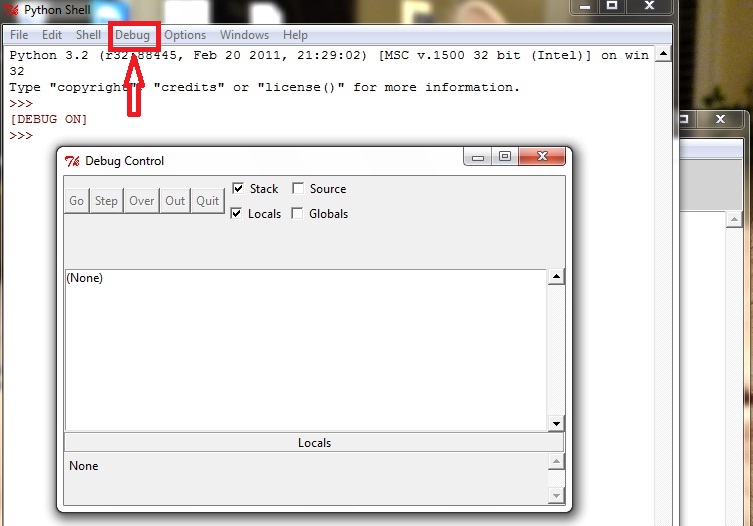
Notice that the Shell shows "[DEBUG ON]".
For the debugger to be most useful, you need to set a breakpoint in your
source code before you start running the program.
A breakpoint is a marker on your code that tells the debugger
"run to this point at normal speed, then pause and let the
human have control". You can have many of them; in more
complex programs you would need them at different places.
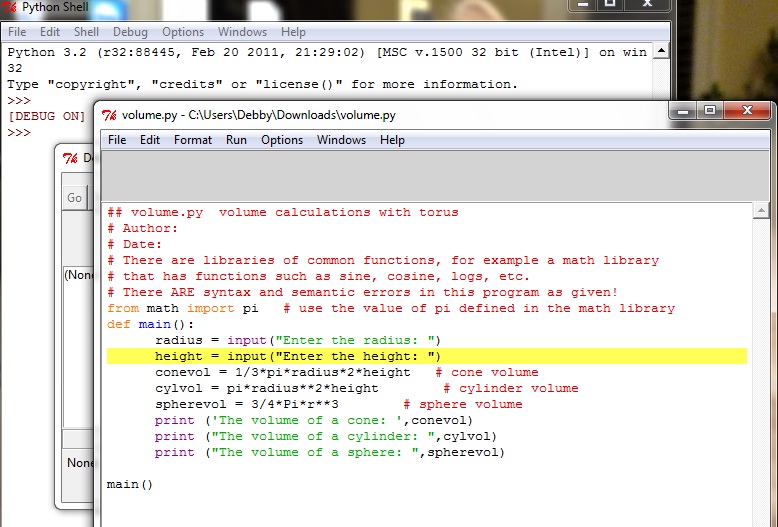
RIGHT click on a line of your source and choose "set breakpoint".
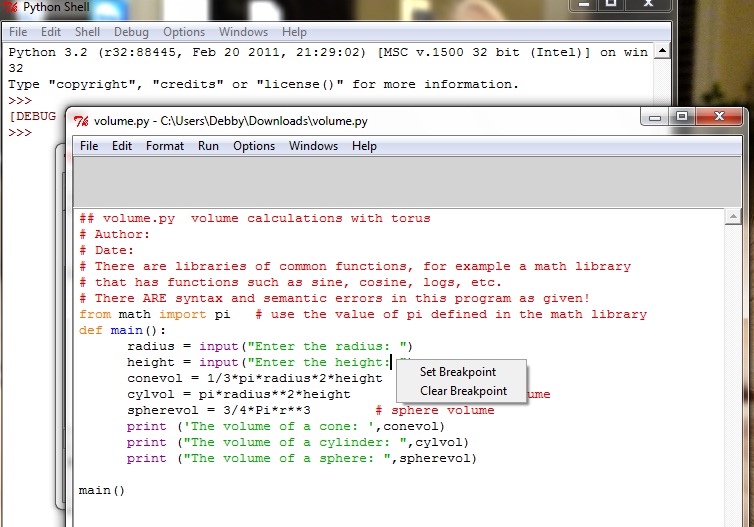
The background of the line you click on turns yellow to show the
line marked with the breakpoint.
If you don't put any breakpoints in your source, when you run it with the debugger on, it will pause at the first line of executable code (may be an import statement or a call to main()) but then will run your program normally (i.e. with no pauses).
Now run the program with F5 as usual.
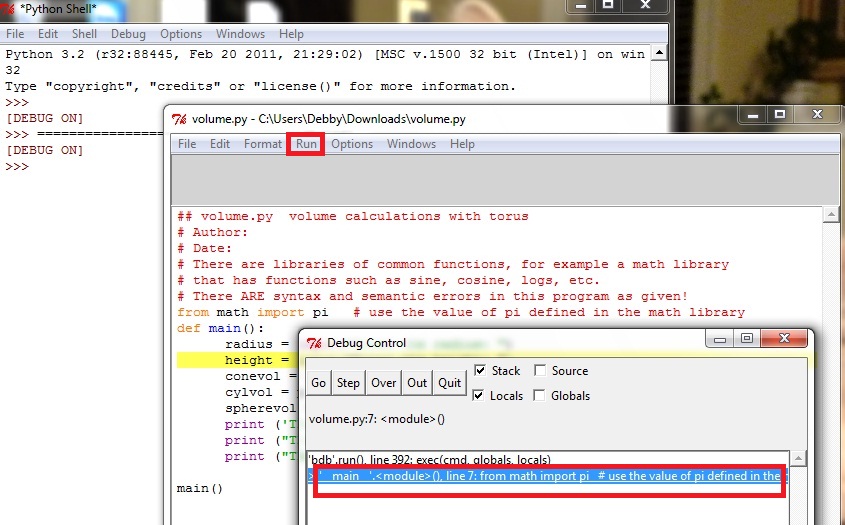
Note that the Debug Control window is opened and that the blue line states that the line "from math import pi" is ready to be executed (the 7 is for line number 7 in the source file).
From this point you can click the Go button near the top of the window. This will make the program run at normal speed until a breakpoint is encountered (or input is requested or the program finishes). You can also use the Step button to step through your code, one line at a time. This button is used quite a lot. If the line being stepped through has a function call, execution will go to the first line of the function definition (you are "stepping into" the function). If the line being stepped through doesn't have a function call, the line is executed. In either case, then control goes back to the human.
When you execute a line that has input in it, the debugger seems to shut down but it has not. If you bring up the Shell window you can see that the program is waiting for input. Make sure your cursor is in the right place on the window and give it some input and press Enter as usual.
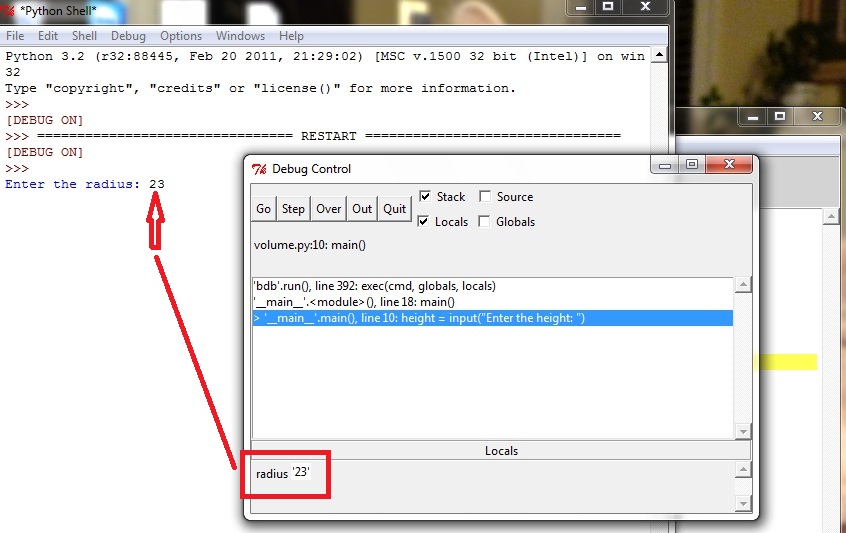
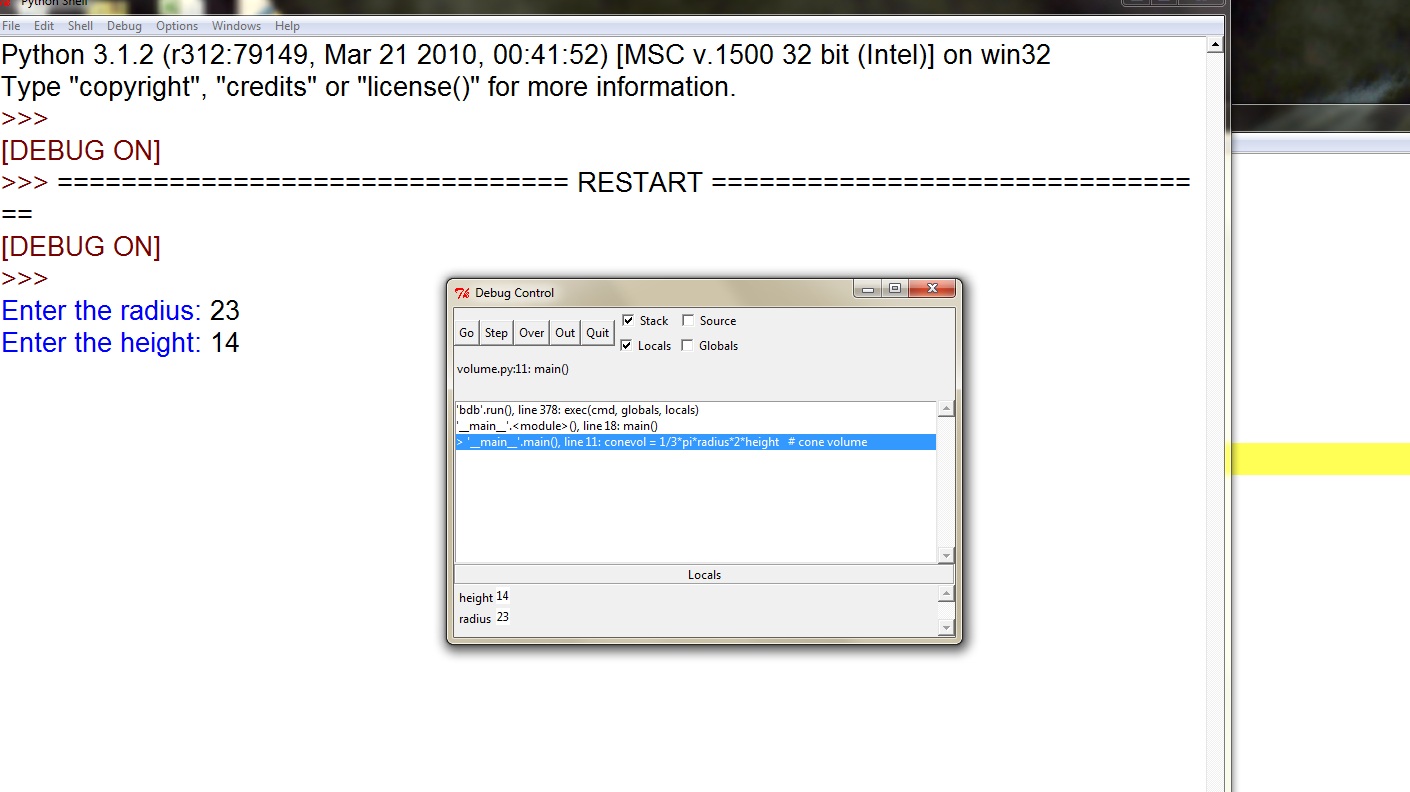
There are several things to note about this picture. The Shell window is in the background, it shows that the user entered 23 and pressed Enter. The Debug Control window shows that execution has moved on to the next line of code. Also, at the bottom of that window there is a pane that says "Locals" and it shows the value of radius to be '23'. This is useful in several ways. It shows the values of variables as they change, and it shows the types of variables. Note that the value of radius has quotes around it. This means that it is a string value.
Click the Step button again.
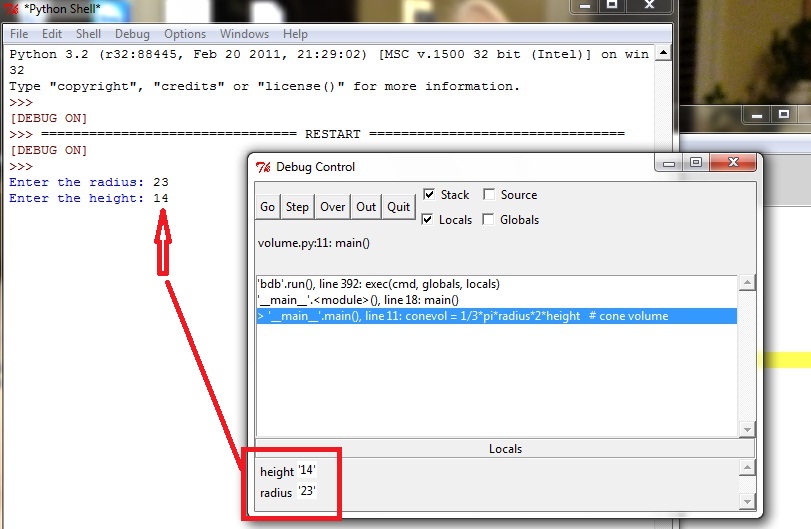
Note that the new variable height has been created and has a value of '14'.
Click the Step button again.
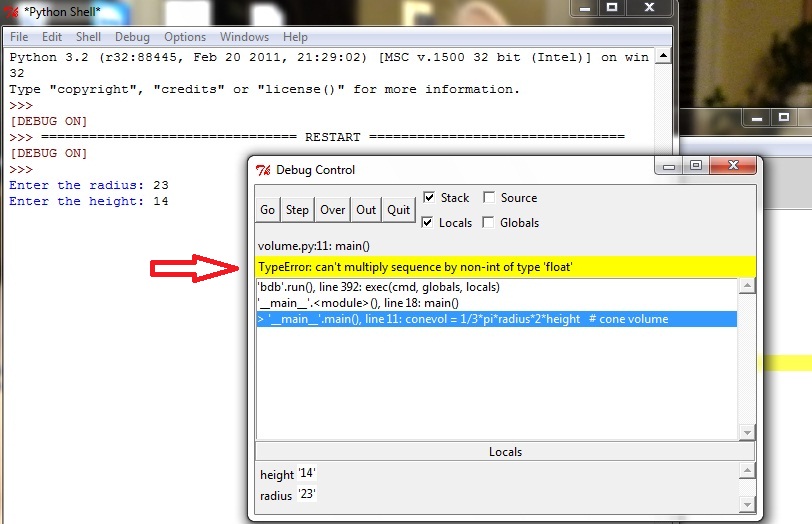
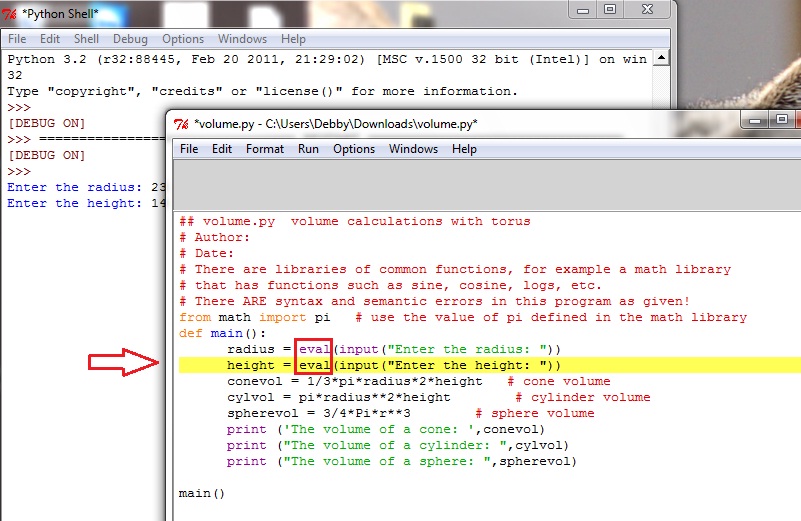
Notice that there is an error in the run of the program at this point (the yellow bar in the Debug Control window). The interpreter is saying that it cannot multiply "sequence by non-int of type 'float'". What it means is that the two input variables are of the wrong type to be combined with numeric types. This has to be corrected before any more debugging takes place. This is fixed by using the eval function in the two input statements.
"You can only toggle the debugger when idle" If you get this message in a window when you try to turn the debugger on, try clicking on the Quit button in the Debug Control window. If that does not help, try shutting down the program file and reopening it. If that does not help, shut down Python completely and restart it from scratch.
Note that the bugs in the input statements have been fixed with the addition of "eval". The breakpoint was put in again. Breakpoint locations are not saved with the program; they have to be set again for every debugging session.
Note the type of the Local variables in this image. They don't have the quotes around the values any more! They are numbers now.
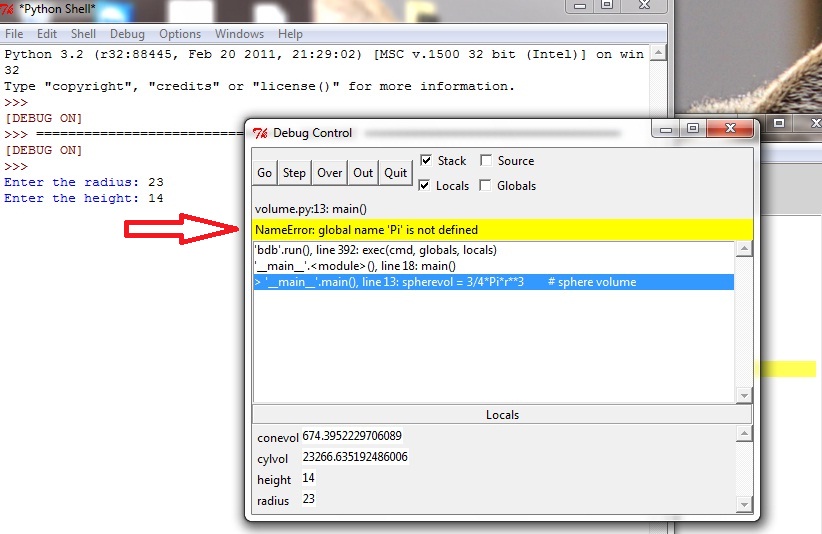
As you step through the program one statement at a time, you can see more variables get values. When we come to the next bug you can see that the variable Pi is not the same as the variable pi, which is defined in the math library. This bug would need to be fixed, then the debugging would continue.
So the process of using the debugger involves
Explanations of a few other things in the Debug Control window